Through the course of last week, we conducted various experiments testing the ideas of pressure versus temperature, number of particles, and volume, as well as the particles in motion of a liquid, solid and gas. To research the movement of particles we incorporated some of last week's experiments into this past week’s lessons. I think this past week has had to be one of my favorite weeks because I really enjoyed the type of hands on work that our groups had to do.
To begin last week, referring to an experiment conducted in previous weeks(hot and cold water with dye), we tested out the idea of how hot and cold molecules work through a liquid. When putting drops of the dye in the cold water, the dye was very resistant in moving throughout the beaker of water. Contrary to the results of the cold water, hot water had more movement of the dye throughout the beaker. Going along with the results of the molecules in the solid, the heat from the water transferred to the dye which allowed the molecules in the dye to have more energy. Hence, more movement. The cold molecules slowed the molecules from the dye down once coming in contact with the water, which caused the dye to fall in one main direction. we focused on the movement of particles and went into depth of how the motion of particles work, being affected by temperature. Next, we worked on how this concept would affect a solid. After watching a video on how the motion of particles are affected, I learned that temperature is a proxy for the relative speed of molecules. The best way to explain this is by using the example shown to us in the video. If you take a balloon filled with air and set it outside of a hot summer day, the heat from the air transfer to the particles in the balloon. The molecules heat up and have a tons of energy. Similar to how if you give a child a bunch of candy, they begin “bouncing off the walls”, heat molecules act the same way. When they begin doing so, the increase in movement of the particles caused my the heat, forces the balloon to expand. On the other hand, cold temperature acts as the opposite. If you place a balloon filled with air outside on a cold winter night, the molecules move slowly. Cold molecules do not have nearly as much energy of hot molecules. The way the cold temperature affects the balloon can be best thought of as the way winter affects penguins. When it is cold, they waddle around very slowly and begin to huddle together to try to stay warm. These molecules act the same way. The molecules move closer together, causing the balloon to contract. Watching the video and having a class discussion about what we observed was our way of understanding the molecular motion in a solid. In continuation, of the lessons of this past week, we also focused on pressure and how it affects temperature, volume and number of particles.
In order to research or test these ideas, our class ran 3 labs. Our first lab was about pressure versus volume. In this lab we had a syringe hooked up to a pressure sensor. To begin, we filled the syringe with air up to 5 mL. After recording the pressure given to us by the pressure sensor, we continued tested pressures of volume. Once testing 5 different volumes, we also began graphing our information onto the computer. I found this part very interesting because we were able to learn how to graph information onto the computer. A major part of the relationship between pressure and volume was how the graph would look. Would the graph be linear, would the graph line be curved, or would the graphing line have a negative relationship, facing downward? These were all questions that our class had to answer. Each table group had a different hypothesis for the outcome of each lab. For the pressure versus volume lab, our table group thought the graph would have a negative relationship(still being linear). For the second test, we did pressure versus temperature. This experiment was a little bit more intense because we tested 3 different temperatures. To do so, we took a beaker filled with hot water, cold water (mixture of ice and alcohol), and room temperature water and put a smaller beaker into each one. The smaller beaker was hooked up to the pressure sensor which measured the pressure of each temperature. For example, 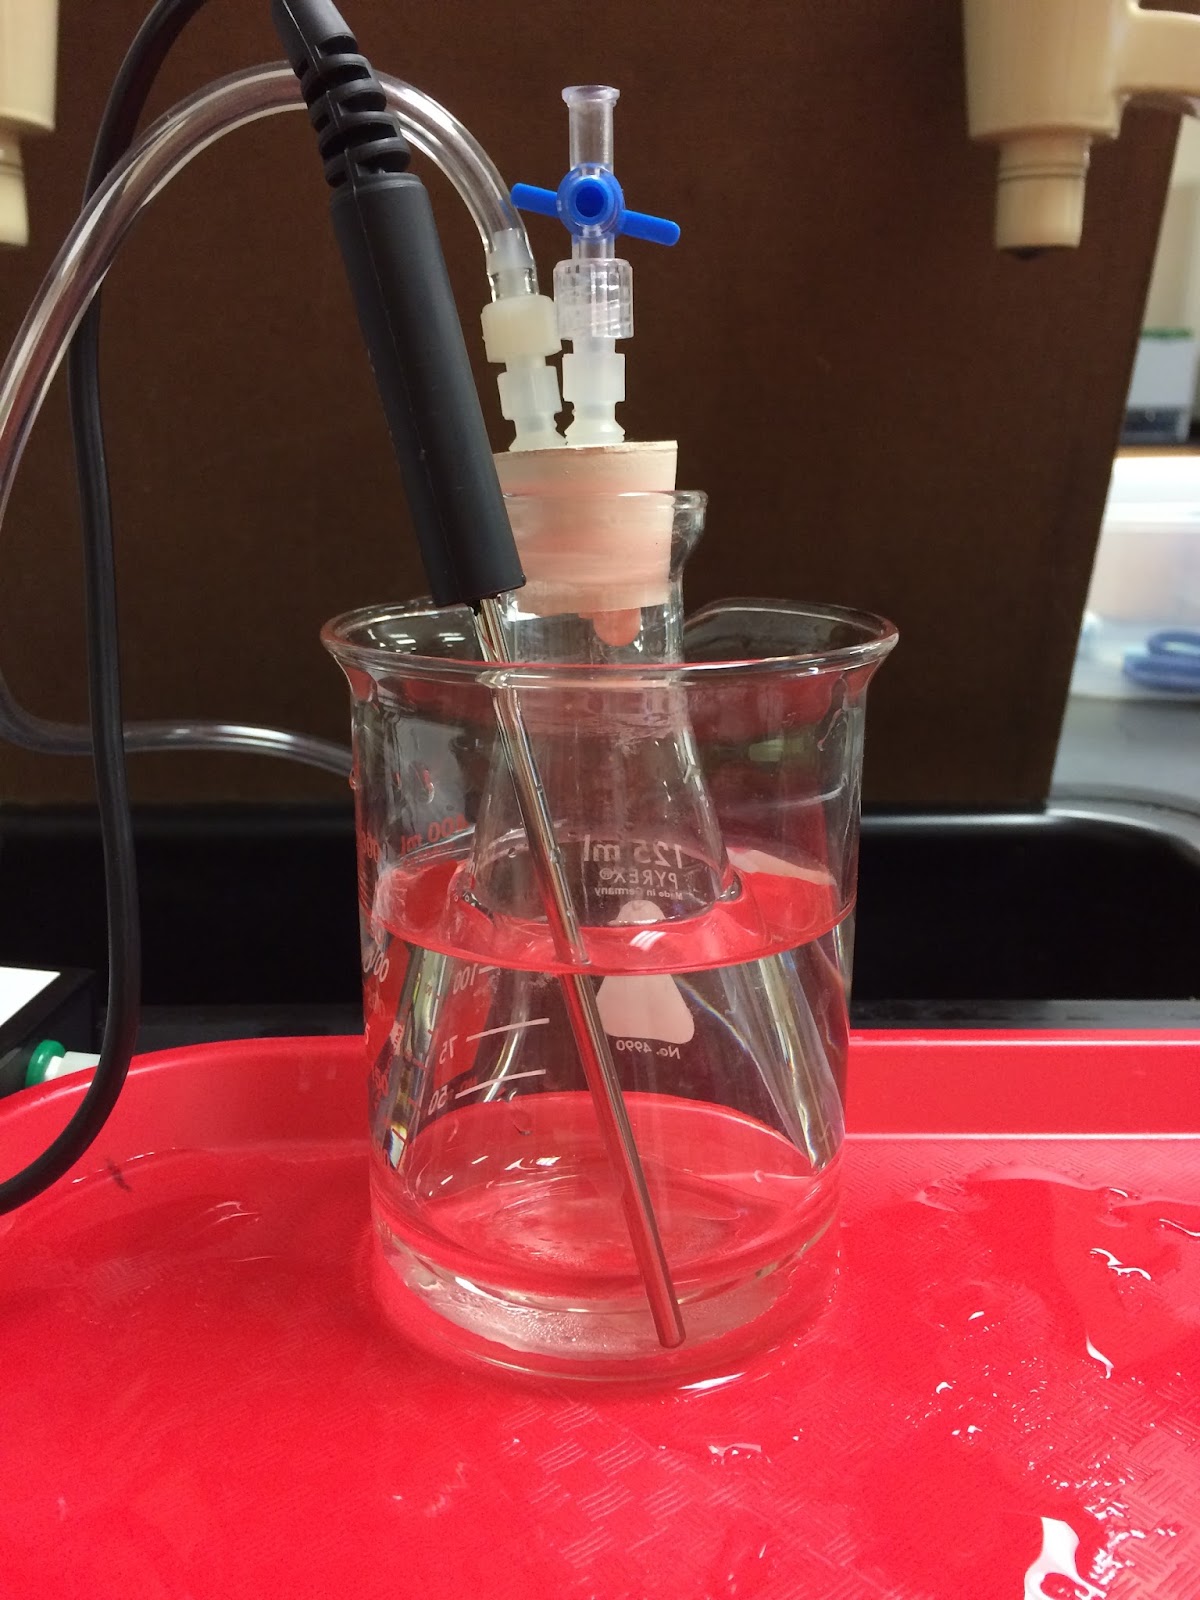 in this picture, it shows hot water being measured for how much pressure it has. Again, these line of experiments were all recorded in computers and were graphed. my table group hypothesized our this graph to have a positive linear relationship. Lastly, we tested pressure versus the number of particles(puffs). For this lab we used the syringe again and adjusted the end the syringe to differentiate how many “puffs” had pressure, more or less. The graphing for this lab was expected to replicate the pressure versus temperature results, to have a positive linear graph. In the end we were able to find out the real relationship of each subject being tested. Here are the correct results that my table group collected:
  Here is the resulting graph of the pressure versus volume experiment.
 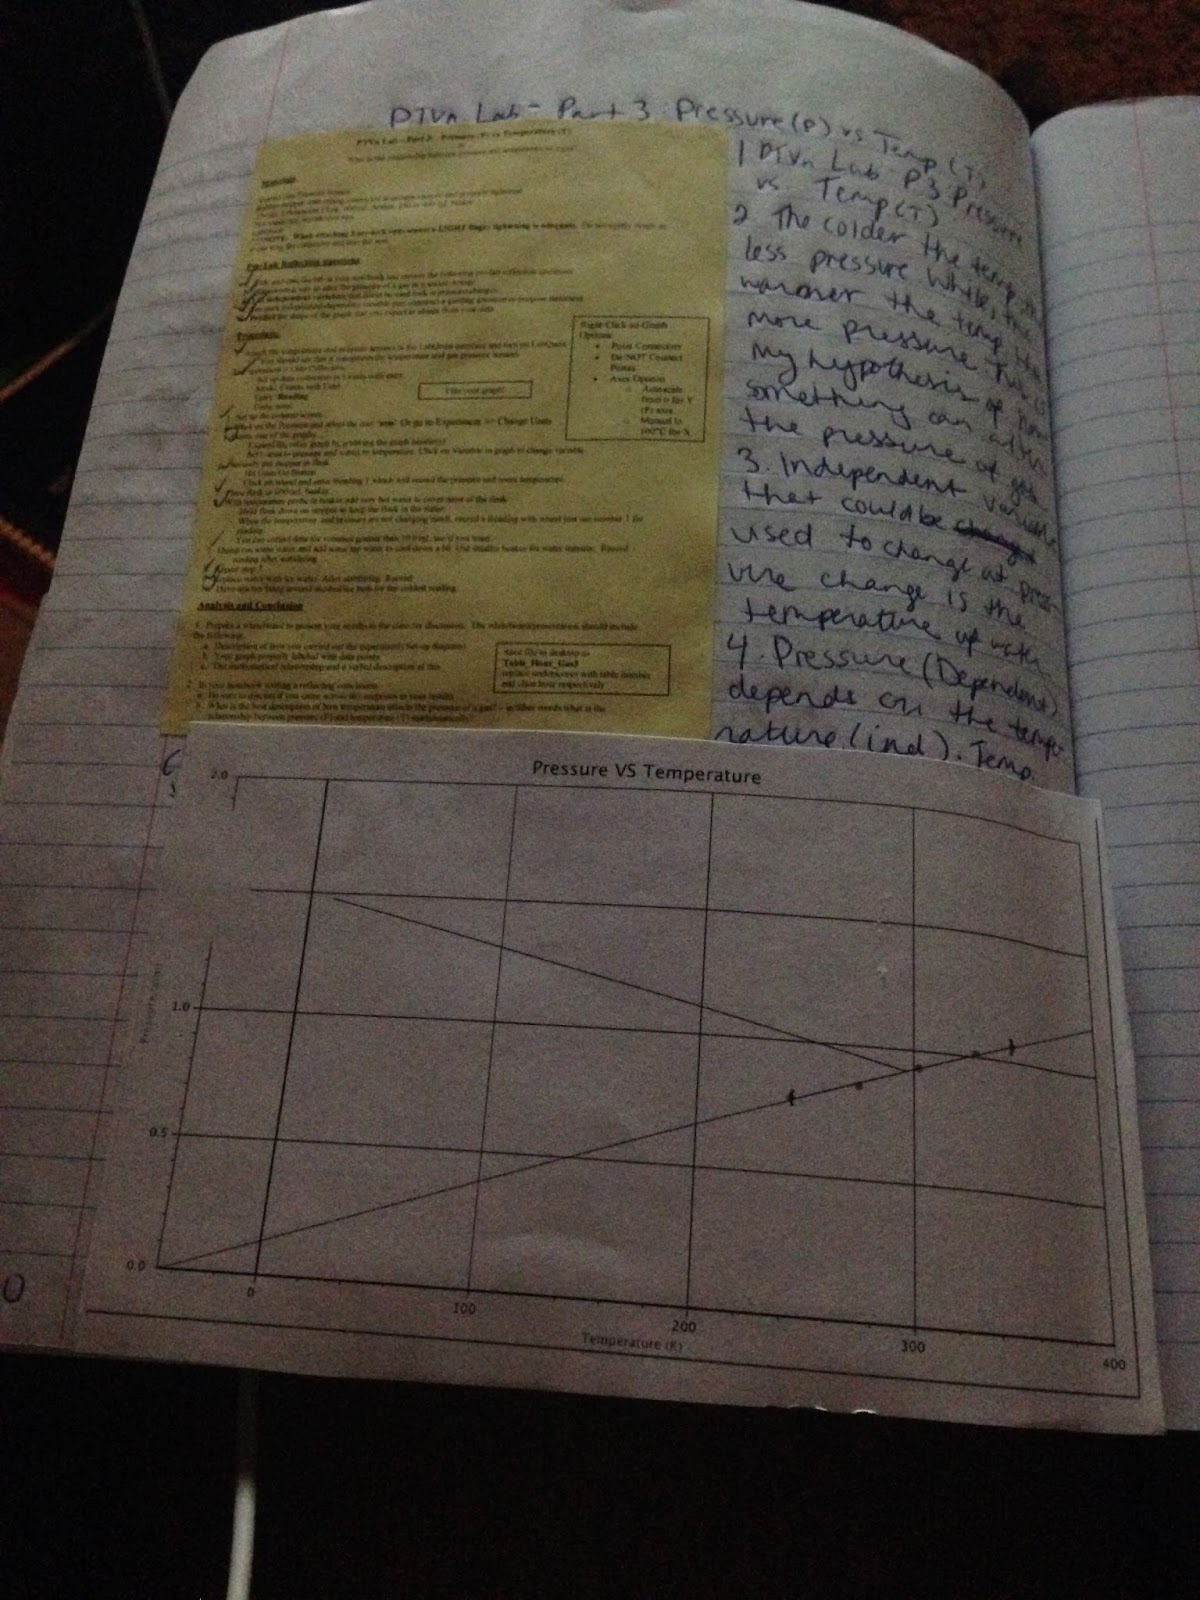 Here is the results our group got from the pressure versus temperature lab and lastly, here are our results for the pressure versus number of particles(puffs) lab:
in this picture, it shows hot water being measured for how much pressure it has. Again, these line of experiments were all recorded in computers and were graphed. my table group hypothesized our this graph to have a positive linear relationship. Lastly, we tested pressure versus the number of particles(puffs). For this lab we used the syringe again and adjusted the end the syringe to differentiate how many “puffs” had pressure, more or less. The graphing for this lab was expected to replicate the pressure versus temperature results, to have a positive linear graph. In the end we were able to find out the real relationship of each subject being tested. Here are the correct results that my table group collected: Here is the resulting graph of the pressure versus volume experiment. Here is the results our group got from the pressure versus temperature lab and lastly, here are our results for the pressure versus number of particles(puffs) lab:
My overall experience with the material for this past week, I’d say was positive. I really enjoyed the activities we did in order to understand the information given to us. From a scale of 1-10, my understand of the information would be an 8. My questions for this past week would just be what the difference is between a molecule and a particle. Other than that, I’d say I grasped the concepts pretty well and enjoyed to lesson taught to us.
No comments:
Post a Comment