Sunday, November 15, 2015

Icy lab, LOL charts and Quantitative problems

       One of the main ideas that our class learned this week was the relationship between ice, water and gas. In order to investigate these relationships, we conducted an Icy Hot Lab. For this lab, we filled a beaker with ice and placed the beaker on a hot plate. Once measuring the temperature (-13.1°C), using a thermometer that was connected to lap quest; we turned on the hot plate and began observing. To make sure the temperature was evenly distributed, we mixed the ice around in a constant motion. We continued mixing and observing the change in matter. After a few minutes we noticed water beginning appear at the bottom of beaker at -4.3°C. We began observing this reaction until the ice turned completely into water (15.4°C) and later reached it’s boiling point (98.5°C). It was up to our class to hypothesize the resulting graph. With the y-axis being temperature and the x-axis being time, my table group and I predicted to the graph to more a positive curved graph:  This means as the time increased, so did the temperature. After discussing the multiple options, we realized that that curved relationship couldn’t work because we wouldn’t be able differentiate the changes in matter. This was our resulting graph: With various whiteboard discussions, our class learned that this graph shows the energy flow through heating during its series of changes. Two main types of energy that play into these transfers are thermal and change phase energy (Eth and Eph). During the inclines of temperature, thermal energy(Eth) is stored. During the plateaus, there is a change in the phase which stores phase energy(Eph). The particles reactions for this graph are pretty simple to comprehend. Here is a diagram that shows the particles movement throughout the energy flow process: From previous labs, we know that colders particles move slower (ice) and warmer particles move faster. Once the process is over, it would have gone through 3 stages(ice>water>gas). Each stage has a different need of energy flow to change one matter to another. Which leads into the second main idea for the week. 
Different matters need different rates of energy applied to it, in order to explore more with this idea, our class did a few LOL charts (Energy flow bar charts). Here is example of one of the charts that my group and I worked through: 
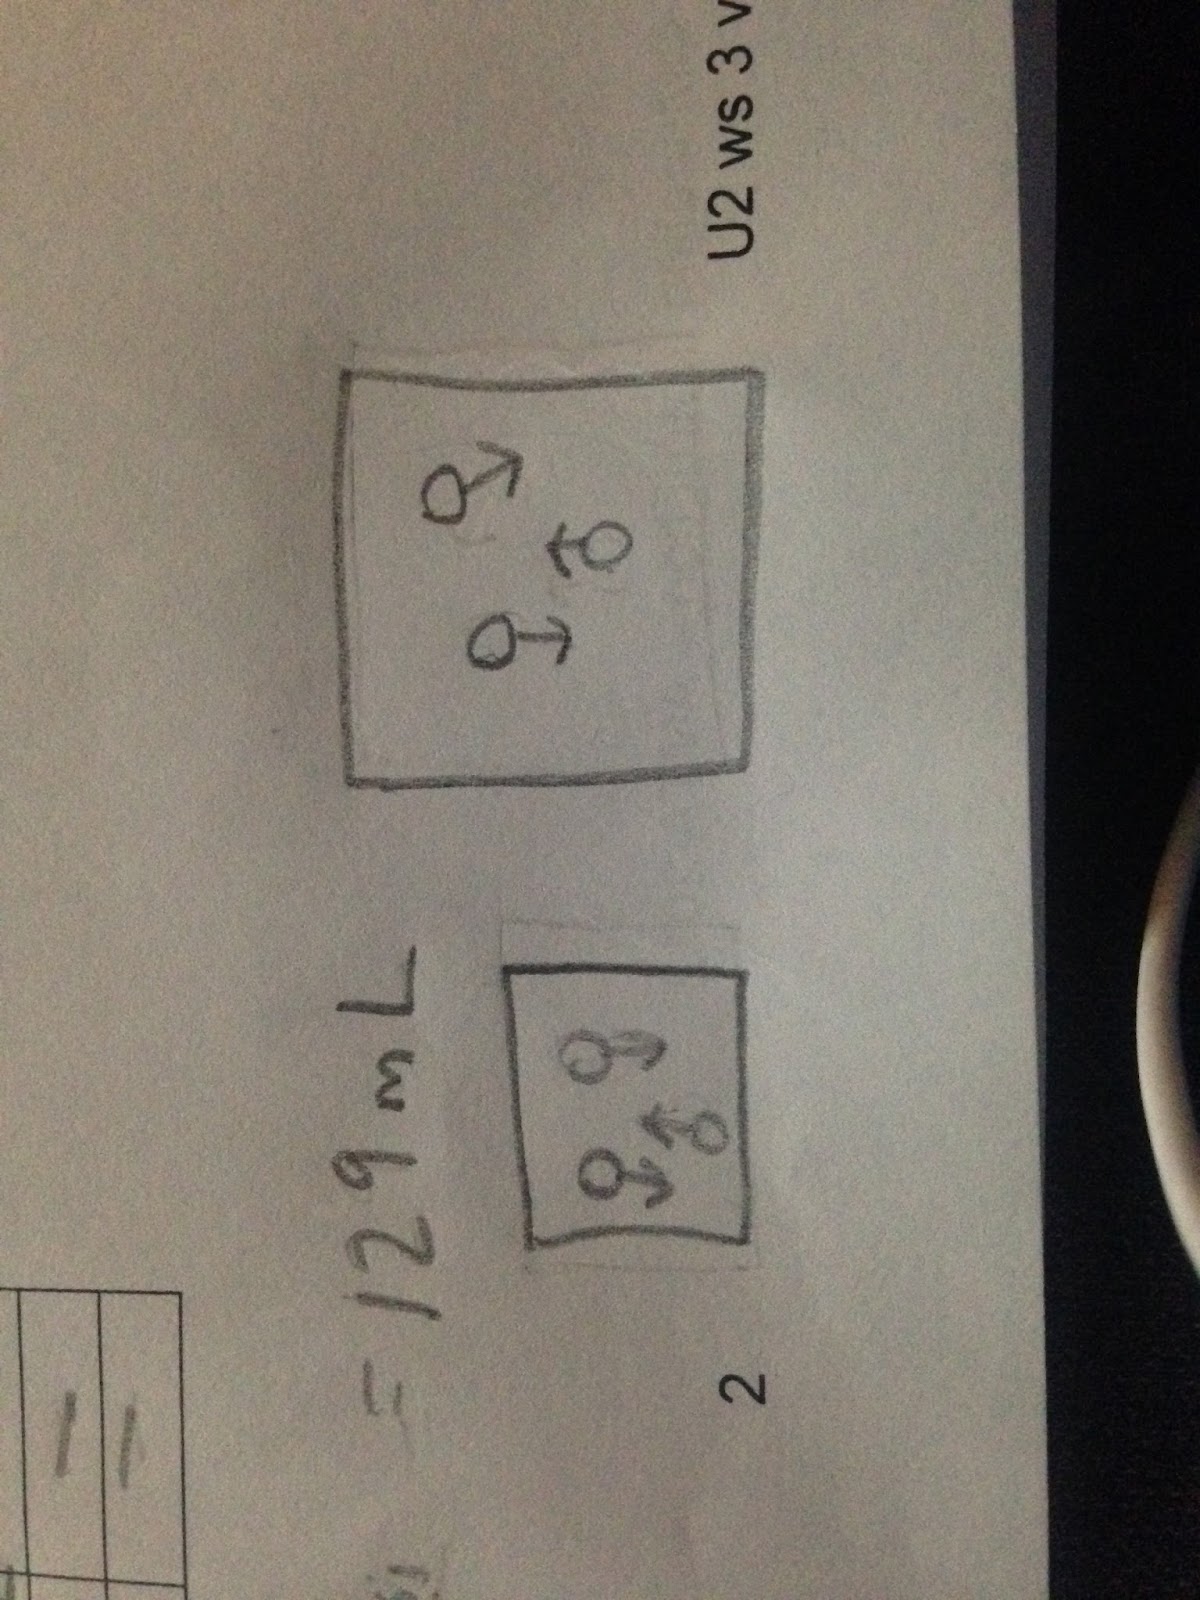
To properly show the flow in energy, a solid is presented as one block, a liquid is two blocks and a gas is four blocks. As the description states, a can of cold soda warms as it is left on a counter. The current phase is a liquid, and is cold. Once sitting on the counter for awhile, the soda is still a liquid so the two blocks stay on the chart. On the other hand, the cold soda did warm up. This means the thermal energy has increased. To show this increase We sketched half a block on the final thermal column. This results in a .5 energy flow increase. Beginning with the energy flow of 3.5 and resulting in 4.0, this means an increase in energy has taken place. We can show this change by putting an arrow towards the circle with half a block stretched behind it. 
Our last main idea for the week was quantitative energy problems. This idea incorporates the objective learned in the icy hot lab. Due to the rate of how much energy is needed to alter various types of matter, there is an energy constant for each one. The purpose for these problems is to be able to calculate the energy used or needed within a reaction. Here is an example of one of the problems our class handelled.To find the energy that was released, we used the equation Q=m(mass) • c(capacity) • the change in T. Once plugging in the accurate data, we solve. We can solve by first cancelling out all units of °Celsius . Keeping in mind that energy is measured in Joules, the product in this case is -32,000 J. 
As we continued this week, we mainly focused on quantitative problems, LOL charts and the significance of the icy hot label. Overall, my head wasn’t in this week's lesson compared to previous weapons. Although I enjoyed the LOL charts and the Icy Hot Lab, I found the quantitative problems to be a bit of a challenge. I felt kind of confused during the lesson and was not too confident about my understanding. I’m interested in doing more LOL charts, yet challenge myself with more quantitative word problems. My comprehension of the quantitative labs would be about a 4, whereas my understanding of the LOL labs are about an 8. Overall, I look forward to applying these concepts in the future and experimenting with them more. 


Tuesday, November 3, 2015

PTVn Tables and Review

The main ideas for this past week were figuring out how to find the correct calculations for our previous known information, through PTVn lab tables. Branching off of the our previous weeks’ main focus (PTVn Labs), this past week we focused on studying the relationship between pressure, temperature and pressure.
In order to find the proper calculations (pressure, temperature, volume, numbers of particles), our class worked through two PTVn problem packets. When working through each problem with our table members, we were instructed to conduct whiteboard discussions for each word problem to ensure everyone comprehended the information. To thoroughly explain how I came to understand this week’s lesson, here is a picture: IMG_8965.JPG Here I am going to work through one of the problems that our class did in order to fully explain the lesson. In the table we have initial data, final data and the effect (positive or negative) slots to record our information. The word problem gives us the proper numbers that allow us to just plug the information into the table. IMG_8966.JPGOnce plugging in the provided information, I know that I do not have to calculate the temperature or number or particles for this problem so I simple cross those slots out. Keeping in mind that our goal for this problem is to find the final volume, we can solve this problem by making an equation. To make this equation, I thought of these numbers as ratios. It was easier for me to think of them as ratios, that way I could properly set up the fractions in the equation. For every 15.5mL, there is 14.7psi and we do not know the final volume but we know there is 10.9psi. To set this up it would be:15.5mL / x = 14.7psi / 10.9psi. Now, from our previous weeks lesson we know that as pressure decreases volume increases ( and vice versa). This means the largest number of pressure needs to go on top of the fraction because the largest number would cause the increase  in volume: FullSizeRender.jpgOnce solving this equation my calculator (95.5 x 14.7 / 10.9), the final volume results were 20. 9mL. From a lesson learned in previous weeks, I also know that our final answer must match in significant figures with the initial information. In this case, the significant figures match. We know this because the initial volume has 3 significant figures and due to our final volume having a zero that is “sandwiched”, also makes the number have 3 significant figures. After figuring out this information, we can thoroughly understand what is taking place in the word problem by drawing out a model: IMG_8970.JPG We know that the effect of the volume increased by not only the dependent of pressure, but the resulting answer of our equation. Knowing this information, we can conclude the final volume to be much larger than initial volume. Another piece of information that is important to know when drawing the model is the temperature and number of particles. We know that temperature and the number of particles were not affected. This means they were a constant variable and did not need to be altered in the model. To show this effect in the final and initial models, I drew the same amount of particles and same size arrows. We continued this lesson with various different scenarios and problems.

The second topic we focused on was studying for the unit 2 test. To prepare for this test we worked through the review guide and discussed the questions with our table groups.

My thoughts of this weeks were positive. I didn’t realize how much our previous lessons would be helpful for us until coming into this week's lesson. I also enjoyed how much we collaborated with our groups more. I liked being able to work through problems and write everything out on our whiteboards. Lastly, I found it helpful to work through some of the review guide in class with our classmates because we were able to thoroughly discuss each problem with one another. My overall comprehension of this week’s lesson from 1-10 would be a 9. I feel confident about having to solve the PTVn tables and would not mind doing them individually. My thoughts of the review guide are a little on the less confident side, but I think if I went through my journal I would be more confident for the test. Overall, I think my progress in the class is improving and I look forward for our next upcoming lessons.